 English
  Русский
 Bahasa Indonesia
 Bahasa Malay
 ไทย
ไทย Español
 Deutsch
 Български
 Français
 Tiếng Việt
 中文
中文 বাংলা
বাংলা हिन्दी
 Čeština
 Українська
 Română

Gold price continues to trade near its recent highs and below major resistance at $1,243.50. Short-term trend remains bullish but I prefer to be neutral or bearish at current or higher levels as long as we trade below $1,243.50. There are some warning signs for bulls that should not be ignored.
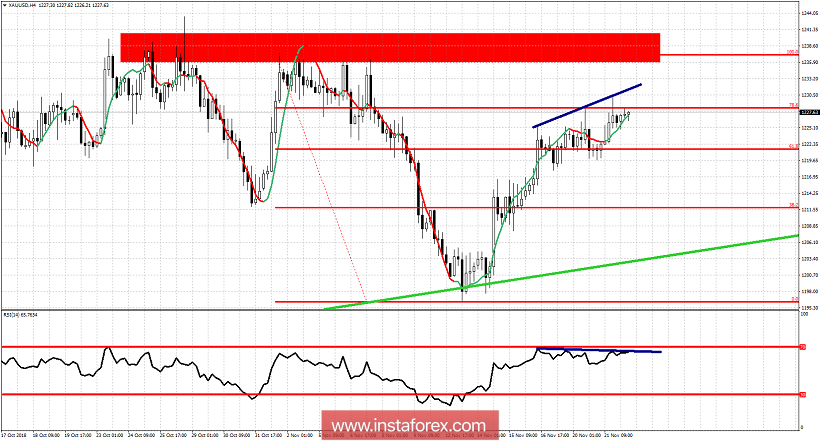
Blue lines - bearish divergence
Green line -major support trend line
Gold price has resistance at $1,232 but the major trend change level is at $1,243.50. The October highs. Support is at $1,219.70 and if broken I will be expecting a new strong downward move that will push price towards the green upward sloping trend line support. In the short-term the chances of a new higher high towards $1,232 are high. But be aware of the bearish RSI divergence. If we see a new high and the divergence persists, I will prefer the short side of the market with stops placed at $1,243.50. Otherwise, any sign of weakness with price breaking below $1,220 would make me bearish again with stops at recent highs.