 English
  Русский
 Bahasa Indonesia
 Bahasa Malay
 ไทย
ไทย Español
 Deutsch
 Български
 Français
 Tiếng Việt
 中文
中文 বাংলা
বাংলা हिन्दी
 Čeština
 Українська
 Română

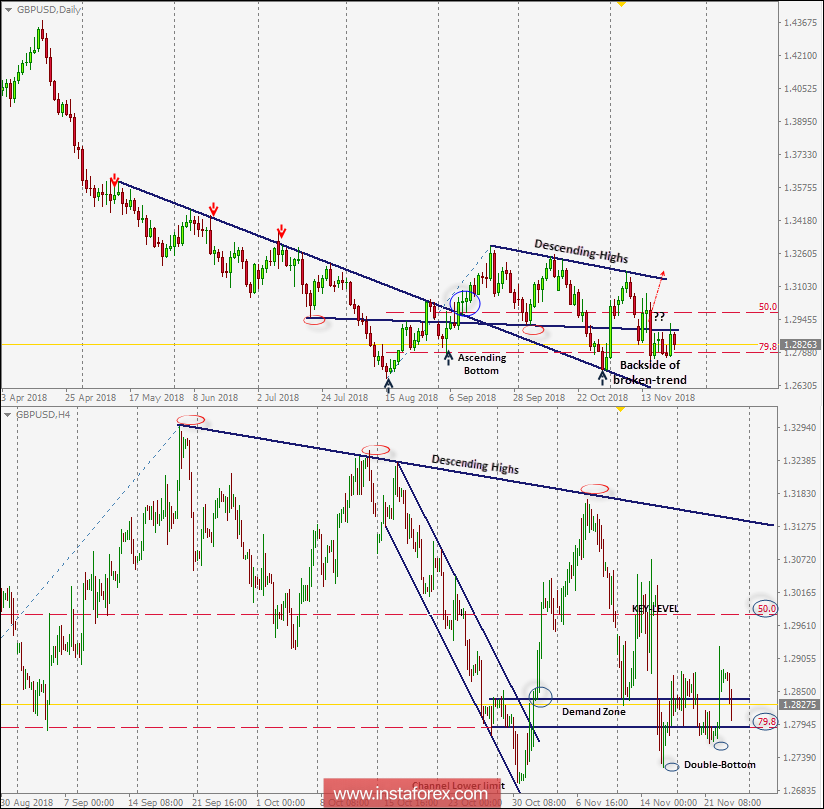
On September 21, the GBP/USD failed to demonstrate sufficient bullish momentum above 1.3296. The short-term outlook turned to become bearish to test the backside of the broken uptrend.
On H4 chart, the GBP/USD pair looked oversold around the price levels of 1.2700 where profitable BUY entries were suggested.
A quick bullish movement was demonstrated towards the price level of 1.3170-1.3200 where the depicted downtrend came to meet the GBP/USD pair.
This initiated the current bearish pullback towards the depicted demand-zone of (1.2850-1.2780) where slight bullish recovery towards 1.2980 (key-level) was overpowered by quick bearish decline towards 1.2720 on November 15.
Recently, the GBP/USD pair failed to establish a successful bullish breakout above the price level of 1.2980 (key-level for the short-term scenario). Moreover, a quick bearish decline was demonstrated towards the price zone around 1.2780.
Early signs of bullish recovery are manifested on the H4 chart. A double-bottom reversal pattern is about to be confirmed.
Bullish persistence above the price zone of 1.2870 (neckline of the reversal pattern) is needed to allow another bullish movement to occur towards 1.2980 and probably 1.3100 where the depicted daily downtrend comes to meet the pair.
On the other hand, bearish decline below 1.2780 invalidates the bullish scenario allowing further bearish decline towards 1.2700 and 1.2670.