 English
  Русский
 Bahasa Indonesia
 Bahasa Malay
 ไทย
ไทย Español
 Deutsch
 Български
 Français
 Tiếng Việt
 中文
中文 বাংলা
বাংলা हिन्दी
 Čeština
 Українська
 Română

Gold price is slowly and steadily turning lower and away from the resistance area and major trend change level of $1,243.50 after topping around $1,230. Gold price has given some bearish divergence signs and according to our plan and expectations is turning lower.
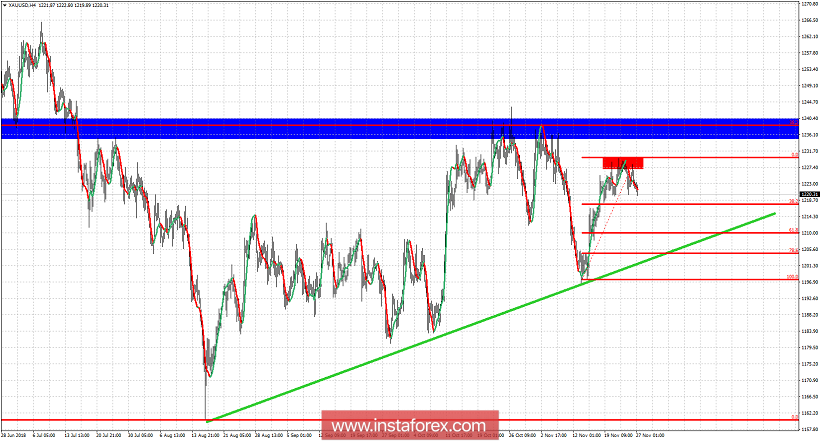
Red rectangle - short-term resistance
Green line - major trend line support
Gold price looks like it has finished the bounce from $1,196 at $1,230. Price should at least pull back towards $1,218 if not $1,210. As I said in previous posts I remain bearish below $1,243.50. If we see price break below the green trend line then the chances of moving below $1,180 will increase dramatically. If price holds above $1,210-$1,200 area then we could see another strong bounce towards $1,240. For now we remain bearish as the bounce is over and we are due for a pull back if not a new downward trend to new lows.