 English
  Русский
 Bahasa Indonesia
 Bahasa Malay
 ไทย
ไทย Español
 Deutsch
 Български
 Français
 Tiếng Việt
 中文
中文 বাংলা
বাংলা हिन्दी
 Čeština
 Українська
 Română

Gold price has broken through short-term resistance and is now looking for a move higher towards $1,250-60 if the major resistance and October highs are broken. So far price action has respected support levels and bulls remain in control.
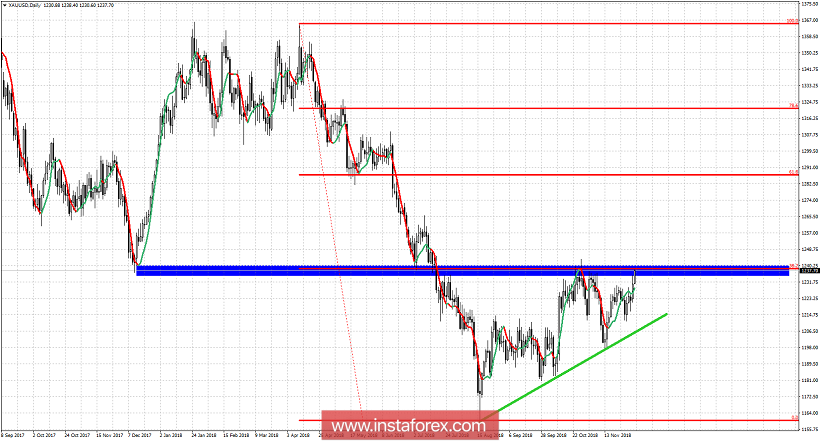
Green line -trend line support
Gold price has held above the critical short-term trend line support and has started making higher highs and higher lows again. Price is now testing the 38% long-term Fibonacci level and October highs. Breaking above this level opens the way for a move towards the 61.8% Fibonacci retracement but our first targets are at $1,250-60. Support is now found at $1,216-20 area and as long as price is above that level, bulls will remain in control of the trend.