 English
  Русский
 Bahasa Indonesia
 Bahasa Malay
 ไทย
ไทย Español
 Deutsch
 Български
 Français
 Tiếng Việt
 中文
中文 বাংলা
বাংলা हिन्दी
 Čeština
 Українська
 Română

Gold price made a new marginal new higher high. Medium-term trend remains bullish as price continues to make higher highs and higher lows. Gold price is heading towards $1,262. Last weeks low is now very important support.
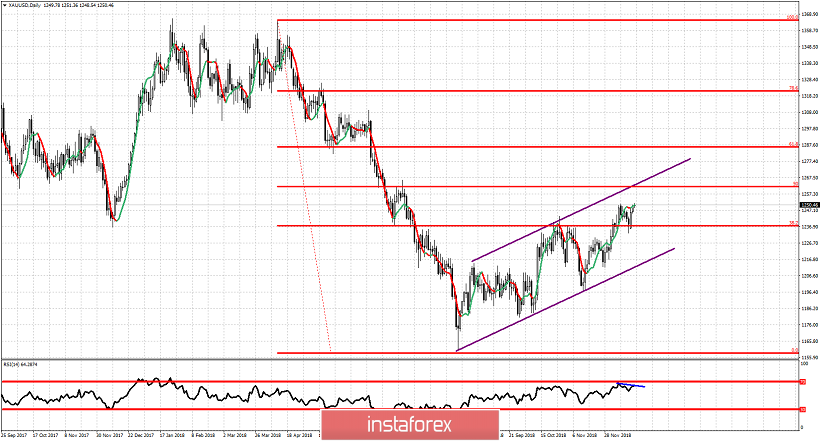
Purple lines - bullish channel
Gold price is now targeting the 50% Fibonacci retracement level and the upper channel boundary at $1,262. The upside is limited for Gold and traders should not chase the bullish side at current levels. Gold price is about to complete the entire leg up from $1,196 around $1,262 and at least make a pull back towards $1,230. The RSI is already giving divergence signs. Short-term trend change level is found at last weeks lows at $1,232.