 English
  Русский
 Bahasa Indonesia
 Bahasa Malay
 ไทย
ไทย Español
 Deutsch
 Български
 Français
 Tiếng Việt
 中文
中文 বাংলা
বাংলা हिन्दी
 Čeština
 Українська
 Română

Gold price continues to trade inside the medium-term bullish channel while in the short-term price looks like it is forming a triangle pattern before its final leg higher. Trend remains bullish and our next target is at $1,310-20 as long as we trade above $1,270.
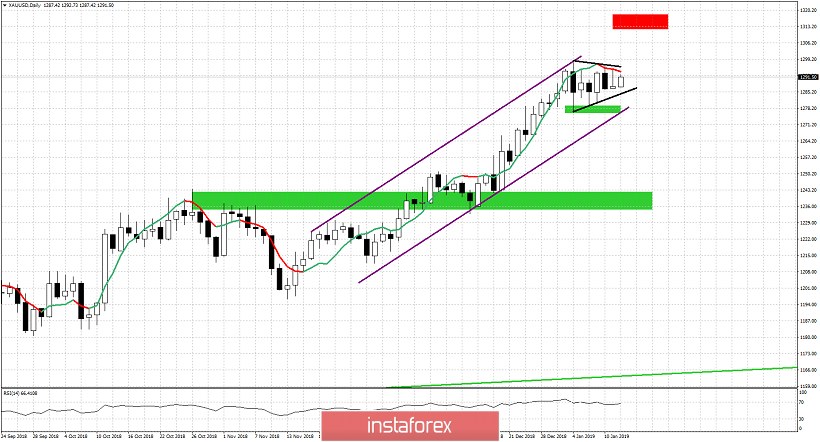
Red rectangle- target area
Purple lines - bullish channel
Black lines - triangle pattern
Gold price has resistance at $1,296. Breaking above it will open the way for a move towards at least $1,310 if not $1,320. Trend remains bullish as price is still above the last green rectangle area and inside the bullish channel. Support is at $1,284 and if broken we could see a test of the lower channel boundary at $1,275. Any move below this area will imply that the upward wave from $1,196 is over and we are in a corrective phase. Only a move below $1,250-40 would cancel the upside potential of Gold towards $1,350.