English
  Русский
 Bahasa Indonesia
 Bahasa Malay
 ไทย
ไทย Español
 Deutsch
 Български
 Français
 Tiếng Việt
 中文
中文 বাংলা
বাংলা हिन्दी
 Čeština
 Українська
 Română

Technical market overview:
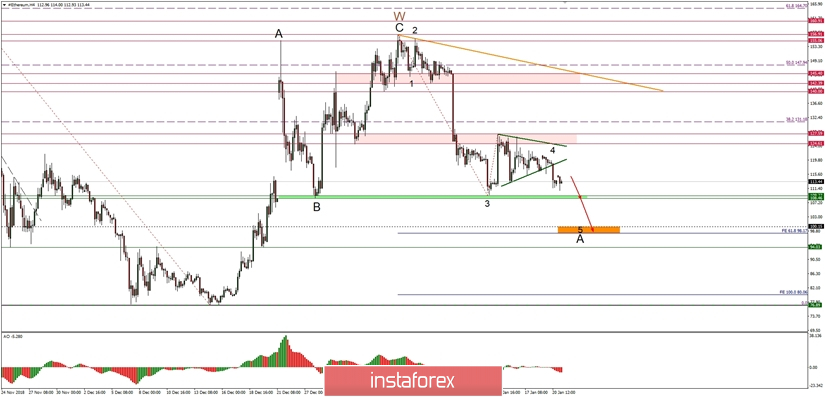
The breakout from the triangle formation has occurred during the weekend as anticipated. The market has broken below the triangle lower trendline at 119.00 and made a new local low at the level of 110.48, just above the technical support at the level of 108.46.
From the Elliott Wave Principle approach, there is still another leg down to be made in form of an impulsive wave 5 to the downside. The projected target zone is seen between the levels of 100.15 - 98.80, but first the technical support at the level of 108.46 must be violated.
The larger time frame trend remains bearish on monthly, weekly and daily time frame charts, so the bears still have control over the market. This is why any upside price developments should be considered as a local correction in a downtrend only. Technical levels to keep an eye on are: support zone between the levels of 108.46 - 109.37 and resistance zone between the levels of 124.61 - 127.59.
Recommendations:
The downside cycle has not been completed yet and there is still a chance for a lower price when the triangle pattern is finally completed. Short positions should be in play as long as the level of 127.59 is not clearly violated. Targets for bears are seen at the level of 109.37, 108.46 and in a case of a further sell off - 100.15-98.80.