 English
  Русский
 Bahasa Indonesia
 Bahasa Malay
 ไทย
ไทย Español
 Deutsch
 Български
 Français
 Tiếng Việt
 中文
中文 বাংলা
বাংলা हिन्दी
 Čeština
 Українська
 Română

Although Gold price remains in an upward sloping channel, there is no sign from bulls that the pull back and correction from $1,300 is over. Bulls need to be very cautious at current levels and as long as price is below $1,292.
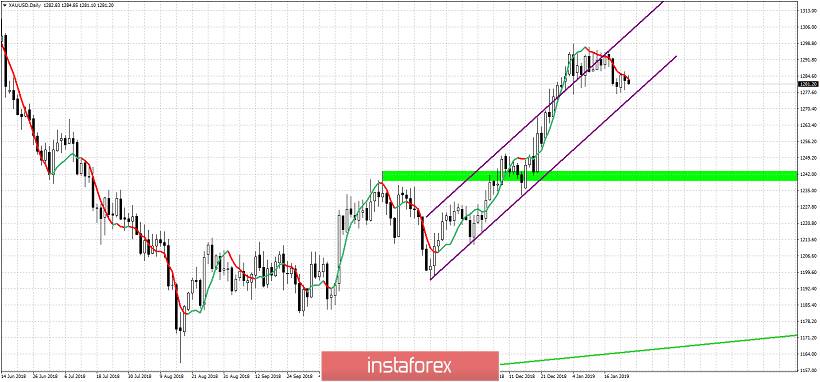
Green area- line in the sand for bullish trend
Gold price has short-term resistance at $1,292. Breaking above it will increase the chances of moving past $1,300 towards $1,320. Support is at $1,276 (channel support) and if broken we expect price to at least move towards $1,270. Next support is at $1,260 where we find the 38% Fibonacci retracement of the rise from $1,196. Breaking below it will open the way for a test of the major support area at $1,243 shown by the green rectangle. If this area fails to hold, then the bullish view for a move above $1,300 is canceled. For now short-term traders favor the bearish side as it has a better risk reward ratio.