 English
  Русский
 Bahasa Indonesia
 Bahasa Malay
 ไทย
ไทย Español
 Deutsch
 Български
 Français
 Tiếng Việt
 中文
中文 বাংলা
বাংলা हिन्दी
 Čeština
 Українська
 Română

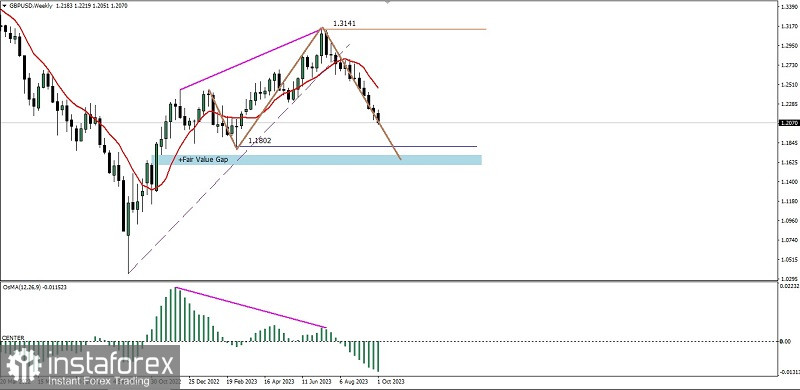
On the weekly chart of GBP/USD currency pairs, there is seems appear the deviation between price movement with its Histogram MACD indicator as well as Cable movement below SMA (10) which the slope going down, where all these facts gives the clue that if in a few weeks ahead, GBP/USD has the potential to weaken to the level 1,1802, unless if on the way to those level suddenly there is an upward correction through the level 1,2423, because if this level successfully breaks above then the downward scenario that has been described before has the potential to cancel iteself.
(Disclaimer)