 English
  Русский
 Bahasa Indonesia
 Bahasa Malay
 ไทย
ไทย Español
 Deutsch
 Български
 Français
 Tiếng Việt
 中文
中文 বাংলা
বাংলা हिन्दी
 Čeština
 Українська
 Română

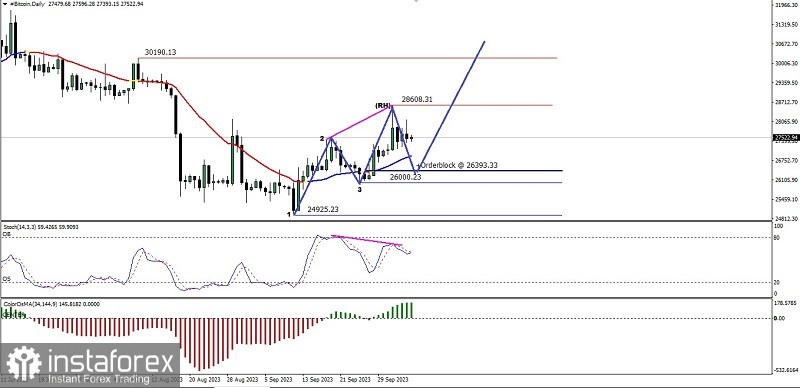
If we look at the daily chart of the Bitcoin cryptocurrency, it can be seen that Bitcoin is creeping upwards, which is confirmed by the emergence of a Bullish 123 pattern followed by a Bullish Ross Hook (RH), followed by its price movement which is above the WMA (30) and the MACD Histogram is in the positive area so that in the next few days Bitcoin has the potential to test breaking above level 28608.31. If this level is successfully penetrated above then Bitcoin has the opportunity to rally upwards to level 30190.13 but due to the emergence of deviations in the Stochastic Oscillator indicator with Bitcoin price movements there is potential correction of the downward movement in Bitcoin where the Bullish Orderblock level 26393.33 will be the target of the correction, but as long as the downward correction does not exceed below the level of 26000.23 then the upward rally scenario in Bitcoin is still valid.
(Disclaimer)