 English
  Русский
 Bahasa Indonesia
 Bahasa Malay
 ไทย
ไทย Español
 Deutsch
 Български
 Français
 Tiếng Việt
 中文
中文 বাংলা
বাংলা हिन्दी
 Čeština
 Українська
 Română

Gold price is making higher highs as expected after breaking above the short-term resistance at $1,317. In our past analysis I mentioned that $1,317 was the key resistance for more upside. Breaking above it would provide a bullish signal.
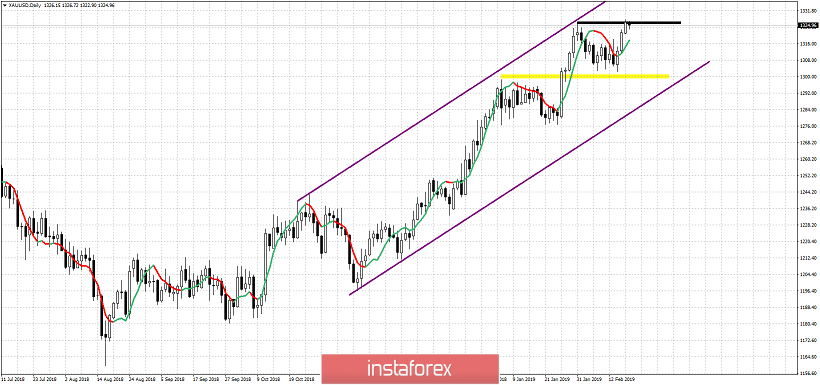
Yellow rectangle - major support
Black line - resistance
Gold price remains in a bullish trend as price continues to make higher highs and higher lows. Support remains at $1,300 and if broken we could see the end of the up trend since August. Resistance and previous highs were broken yesterday but price remains around this area. As long as price is above $1,311 we continue to expect to see $1,330-40 area.