 English
  Русский
 Bahasa Indonesia
 Bahasa Malay
 ไทย
ไทย Español
 Deutsch
 Български
 Français
 Tiếng Việt
 中文
中文 বাংলা
বাংলা हिन्दी
 Čeština
 Українська
 Română

EUR/USD as expected continued its bounce towards 1.14 but only managed to move as high as 1.1371 and the 50% Fibonacci retracement level. The rejection at the 50% level is a bearish sign.
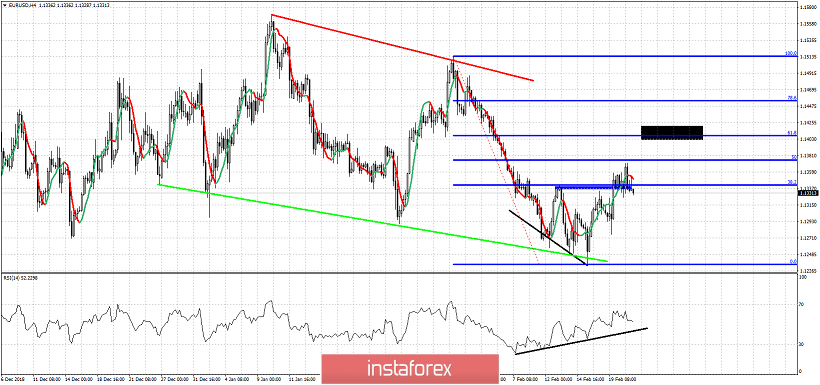
Red line - trend line resistance
Green line - support
Blue rectangle - First bounce target (reached)
Black rectangle- second bounce target
Support is found at 1.1275 and as long as we trade above it there are still hopes for a bounce towards 1.14. Price is now trading around the 38% Fibonacci retracement level after being rejected at the 50%. This is a bearish sign. However the RSI is still making higher highs and higher lows respecting the black trend line support. Medium-term trend remains bearish as long as price is below 1.15. Any bounce is considered a selling opportunity as long as we trade below 1.15.