 English
  Русский
 Bahasa Indonesia
 Bahasa Malay
 ไทย
ไทย Español
 Deutsch
 Български
 Français
 Tiếng Việt
 中文
中文 বাংলা
বাংলা हिन्दी
 Čeština
 Українська
 Română

EUR/USD continues to trade around the 38% Fibonacci retracement having made a base around 1.1310. Short-term trend remains bullish with potential target at least 1.14.
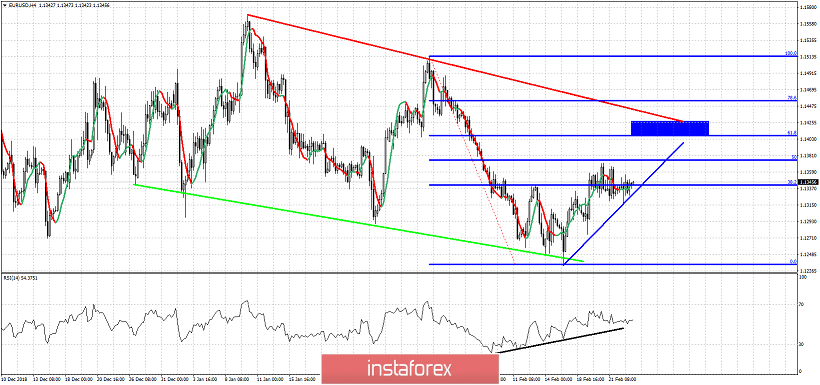
Green line - important support trend line
Black line - RSI Support trend line
Blue line - short-term trend line support
Blue rectangle - second bounce target area
EUR/USD is making higher highs and higher lows in the short-term price. Both RSI and price respect their short-term support trend lines. As long as this holds, we should expect price to move towards the red trend line resistance and the blue rectangle target area where the 61.8% Fibonacci level and the red downward sloping trend line meet. Short-term support is found at 1.1310-1.1330 while resistance is at 1.1370 and next at 1.1410.