English
  Русский
 Bahasa Indonesia
 Bahasa Malay
 ไทย
ไทย Español
 Deutsch
 Български
 Français
 Tiếng Việt
 中文
中文 বাংলা
বাংলা हिन्दी
 Čeština
 Українська
 Română

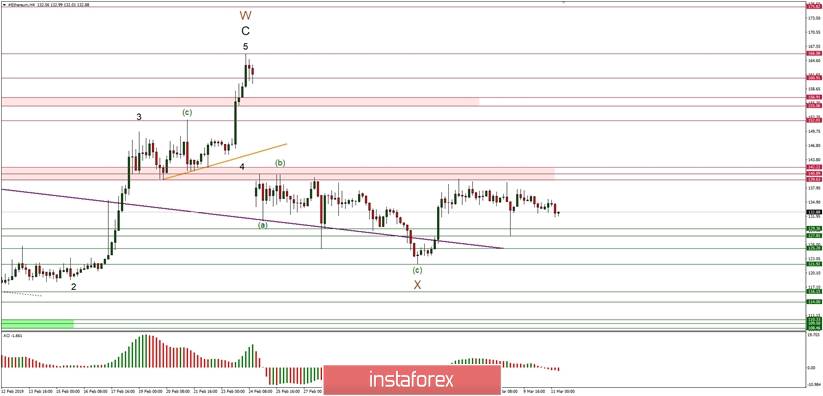
Ethereum Elliott Wave analysis for 11/03/2019:
Bullish rally lost momentum
Technical Market Overview:
The wave X at the ETH/USD market has might have been completed, but the bulls are not able to break through the technical resistance zone located between the levels of 139.63 - 142.22. This is why the wave X might now be still unfolding into a more complex and time-consuming pattern, which means another leg down for this market.
Weekly Pivot Points:
WR3 - 160.89
WR2 - 150.37
WR1 - 143.35
Weekly Pivot - 132.11
WS1 - 124.46
WS2 - 114.39
WS3 - 108.32
Trading Recommendations:
The battle of the technical resistance zone has been lost by bulls, so now only sell orders should be open as close as possible to the level of 139.00 The protective stop-loss orders should be placed at 140.00 level as any violation of this level will invalidate the short-term bearish outlook. The first target is seen at the level of 129.36, then at 127.85 and 125.20. Any violation of the wave X low at the level of 131.92 will confirm the bearish outlook.