 English
  Русский
 Bahasa Indonesia
 Bahasa Malay
 ไทย
ไทย Español
 Deutsch
 Български
 Français
 Tiếng Việt
 中文
中文 বাংলা
বাংলা हिन्दी
 Čeština
 Українська
 Română

Gold price has made zero progress over the first quarter and has ended where it started. Price managed to reach $1,346 area but got rejected at the major long-term resistance. Weekly trend is in danger of turning bearish again.
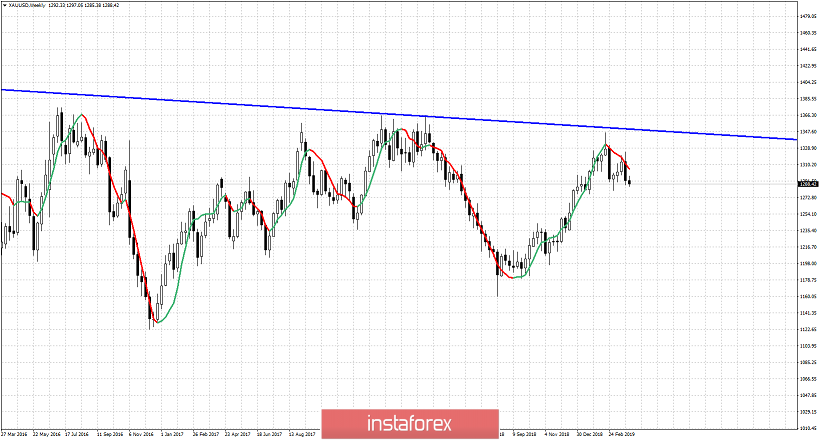
Gold weekly chart as shown above shows us how price is getting rejected and getting away from $1,300 once again. Gold price rallied at the start of the quarter but finished where it started. Gold price is in danger of turning weekly trend to bearish, as it has been rising in a weekly bullish trend since last September. $1,280-90 area is important support and a break below it will open the way for a pull back towards $1,250-60 at least. Key resistance is at $1,326 and I favor bearish positions as long as we are below it.