 English
  Русский
 Bahasa Indonesia
 Bahasa Malay
 ไทย
ไทย Español
 Deutsch
 Български
 Français
 Tiếng Việt
 中文
中文 বাংলা
বাংলা हिन्दी
 Čeština
 Українська
 Română

Last week Gold bears were warned by the bullish divergence signs and the fact that support at $1,280-90 area was respected. Gold price is now bouncing having broken above short-term resistance heading at least towards $1,310-15 area.
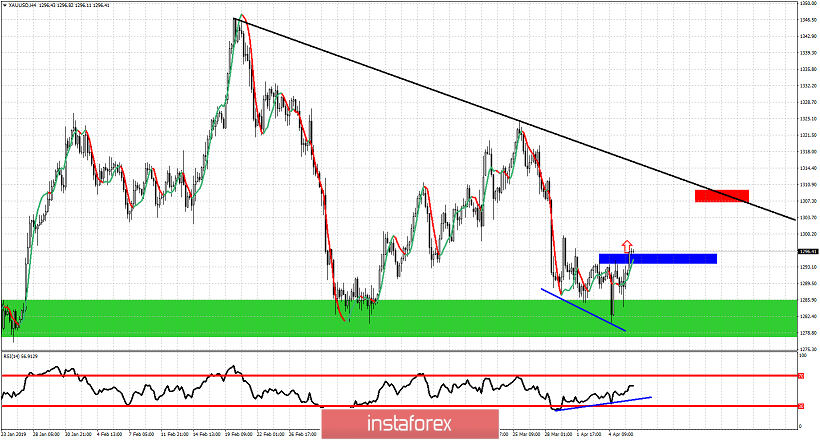
Blue rectangle - short-term resistance
Red rectangle - short-term target
Blue lines - bullish divergence
Black line - major trend line resistance
Gold price has broken above short-term resistance and as long as it holds above the blue rectangle area I expect prices to move higher towards the red rectangle and to test the black major trend line resistance around $1,310-$1,315. Support remains strong at $1,290-80 and we will not go towards $1,250-60 as long as price respects this support level. In the short-term we are bullish expecting price to challenge more important resistance levels. Bulls need to recapture $1,300 and stay above it in order to hope for a move towards $1,350-60 first than a move to $1,250 and lower.