English
  Русский
 Bahasa Indonesia
 Bahasa Malay
 ไทย
ไทย Español
 Deutsch
 Български
 Français
 Tiếng Việt
 中文
中文 বাংলা
বাংলা हिन्दी
 Čeština
 Українська
 Română

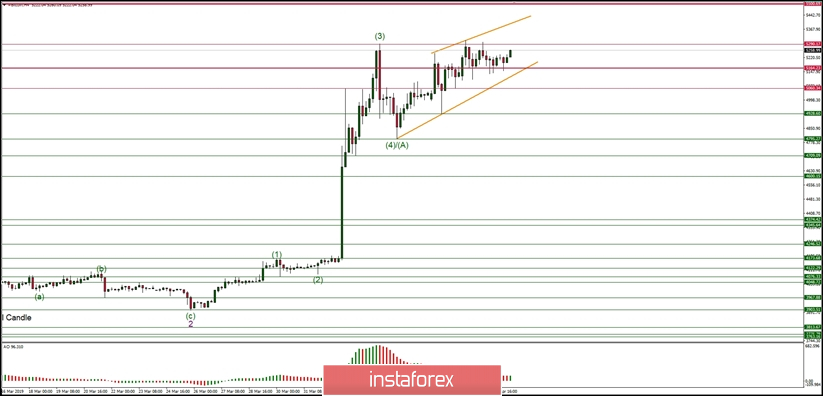
Technical market overview:
The two orange lines on the chart might be helpful to determine whether the Ending Diagonal pattern on the BTC/USD market has completed yet or not. There is still one more wave to the upside missing in order to complete the pattern and the whole upward cycle since the 25th of March. The nearest support is seen at the level of $5,060 and if this support is violated, then another move down can unfold towards the level of $4, 928. Please notice, that the breakout from the Ending Diagonal pattern is very often sudden and severe, so it is worth to keep an eye on the current developments.
Weekly Pivot Points:
WR3 - $6,920
WR2 - $6,094
WR1 - $5,671
Weekly Pivot - $4,832
WS1 - $4,470
WS2 - $3,620
WS3 - $3,234
Trading recommendations:
The market needs one more wave to the upside so the longer-term buy order should remain open and the protective stop-loss might be moved higher to the level of $4,794. The daytraders should keep an eye on the level of $5,060 as any breakout below this level would indicate a deeper correction and further wave (4) development.