 English
  Русский
 Bahasa Indonesia
 Bahasa Malay
 ไทย
ไทย Español
 Deutsch
 Български
 Français
 Tiếng Việt
 中文
中文 বাংলা
বাংলা हिन्दी
 Čeština
 Українська
 Română

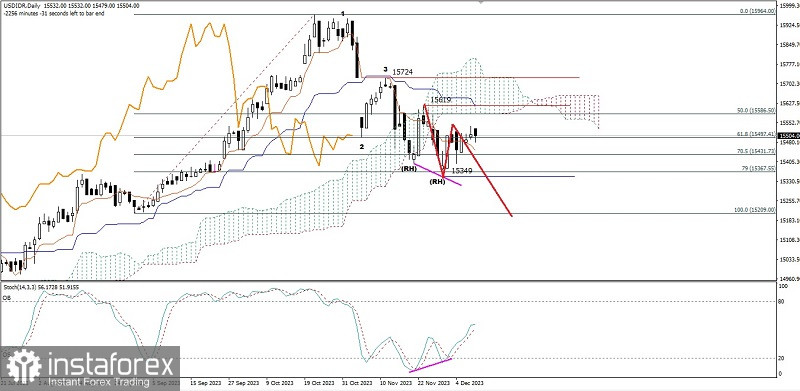
If we look on the daily chart of USD/IDR exotic currency pairs, there is seems a few interesting things:
1.Price movement and Tenkansen is under the Kumo.
2. Kinjun Sen is inside the Kumo.
3. Chikou Span eventhough under the price movement, but still above the Kumo.
4. There is a deviation between price movement with Stochastic Oscillator indicator.
5. The appearance of Bearish N Wave (Bearish pattern 123)
From the four things we can conclude that the strength of Garuda currency still premature and still keep the weakness potential where as long there is no weakness on USD currency pairs until breaks above the level 15724, then in a few days ahead, Rupiah still has the potential to strengthen until the level 15349 as the main target and level 15209 as the next target.
(Disclaimer)