 English
  Русский
 Bahasa Indonesia
 Bahasa Malay
 ไทย
ไทย Español
 Deutsch
 Български
 Français
 Tiếng Việt
 中文
中文 বাংলা
বাংলা हिन्दी
 Čeština
 Українська
 Română

Gold price as mentioned in our last analysis has broken below important support area. Gold price remains in a bearish trend since topping back in February 2019. Gold price target is at $1,250-60 and we may also see a deeper correction towards $1,220.
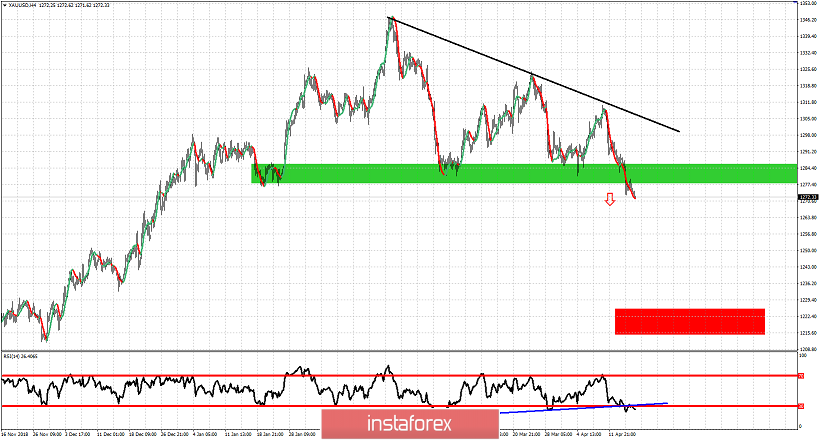
Red rectangle - target
Black line - major resistance trend line
Blue line - RSI support trend line (broken)
Gold price is trading below the important support level of $1,280-90. We could see a back test of this area which is now resistance. However our target of $1,250-60 remains intact as long as price is below the black trend line resistance at $1,300-$1.305. Support is found next at $1,250-60 area. As long as we trade below the black trend line resistance any bounce is considered as a selling opportunity.