 English
  Русский
 Bahasa Indonesia
 Bahasa Malay
 ไทย
ไทย Español
 Deutsch
 Български
 Français
 Tiếng Việt
 中文
中文 বাংলা
বাংলা हिन्दी
 Čeština
 Українська
 Română

Gold price despite having broken below the major support area of $1,280, it remains resilient and has not accelerated the decline towards $1,250-60. The oversold short-term conditions justify a bounce towards $1,300 as we mentioned in a previous post and we remain bearish as long as price is below that area.
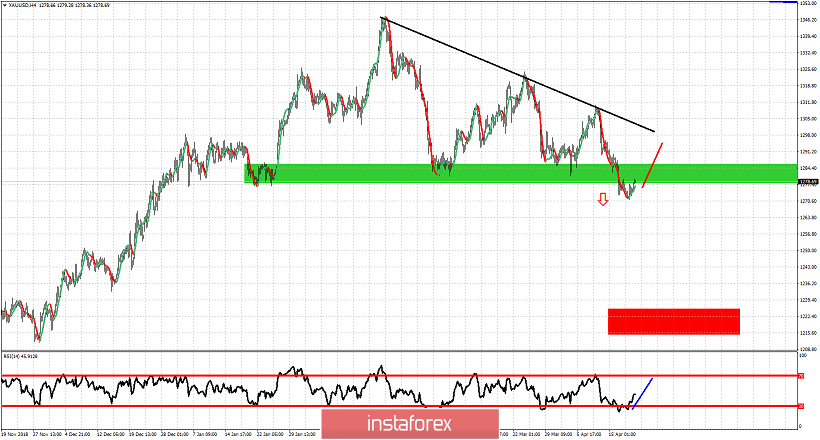
Green rectangle - major support
Red rectangle - target
Black line - major resistance trend line
Red line - expected move
Blue line - RSI expected move
RSI is turning upwards from oversold levels and this implies we could see price of Gold back test the $1,280-90 previous support now resistance area, before moving lower towards $1,250-60 which is our first target as long as price is below the black downward sloping trend line. Trend remains bearish. Any upside bounce with price below $1,300 is currently considered a selling opportunity. Breaking above $1,300 and holding above it would be a bullish sign.