 English
  Русский
 Bahasa Indonesia
 Bahasa Malay
 ไทย
ไทย Español
 Deutsch
 Български
 Français
 Tiếng Việt
 中文
中文 বাংলা
বাংলা हिन्दी
 Čeština
 Українська
 Română

BTC price has been trading upwards in past few hours and the level of $5.462 got tested. There is potential for more upside on the near term.
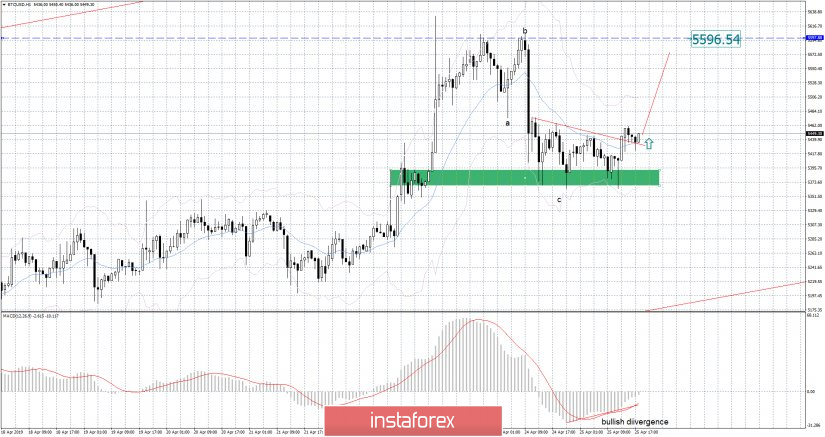
Red line – major resistance trend line * broken
Green rectangle – strong support based on price action
Blue horizontal line – Major short-term resistance
BTC price broke above the important $5.443 resistance trendline and on that way confirmed further strength. Most recently that price did reject from the strong support zone (green rectangle) at $5.368, which is sign that buyers came into the market. MACD is showing bullish divergence, which is another sign of the potential strength. Upward target at the price of $5.596.