 English
  Русский
 Bahasa Indonesia
 Bahasa Malay
 ไทย
ไทย Español
 Deutsch
 Български
 Français
 Tiếng Việt
 中文
中文 বাংলা
বাংলা हिन्दी
 Čeština
 Українська
 Română

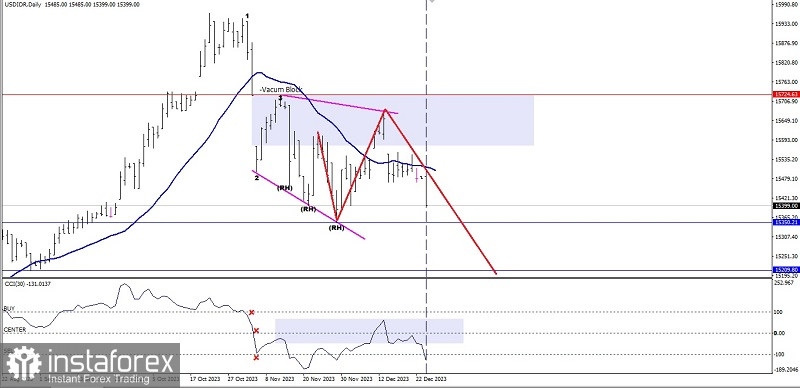
On the daily chart of USD/IDR exotic currency pairs, there is the weakness where this can be seen from CCI indicator which manages to breaks below the three important levels (100, 0, & -100) and now it is hold on to the level area of -100 -0, besides, the price movement is also below the WMA 30 shift 2 along with the appearance of Bearish 123 pattern followed by a few Bearish Ross Hook (RH) so that based on those facts, in a few days ahead, USD/IDR has the potential to test the level below the current price which is 15350.21 as the first target and 15209.80 as the second target but because of the appearance of Descending Broadening Wedge pattern, there is a possibility of the reverese weakness direction at USD. IDR will be strong especially if it breaks above the level 15724.63 so that if this level successfully broken above, then all the weakness scenario that has been described previously will become invalid and cancel itself.
(Disclaimer)