 English
  Русский
 Bahasa Indonesia
 Bahasa Malay
 ไทย
ไทย Español
 Deutsch
 Български
 Français
 Tiếng Việt
 中文
中文 বাংলা
বাংলা हिन्दी
 Čeština
 Українська
 Română

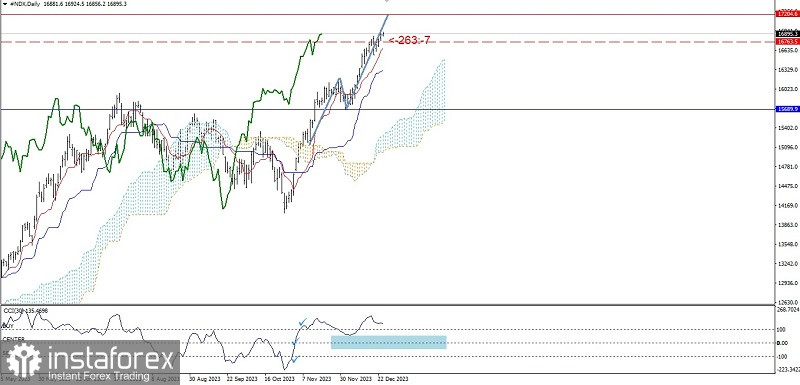
With Tenkansen & Kinjunsen condition intersecting with Golden Cross above the Kumo dan Chikou Span as well as the price movement which is above the Kumo as well, then it is certain now that bias from Nasdaq 100 index still in the Bull condition which is supported by the confirmation from CCI indicator which manages to break above its 3 main levels (-100, 0, & 100) and now hold on to the level area of 100-0, then as long as there is no weakness correction that breaks below the level of 15689.9, then based on the calculation from E Projection then #NDX has the potential to test the level 17204.6.
(Disclaimer)