 English
  Русский
 Bahasa Indonesia
 Bahasa Malay
 ไทย
ไทย Español
 Deutsch
 Български
 Français
 Tiếng Việt
 中文
中文 বাংলা
বাংলা हिन्दी
 Čeština
 Українська
 Română

USD/JPY has been trading upwards post FOMC minutes. The price did test the level of 111.65. We are expecting more upside on the USD/JPY In the next period.
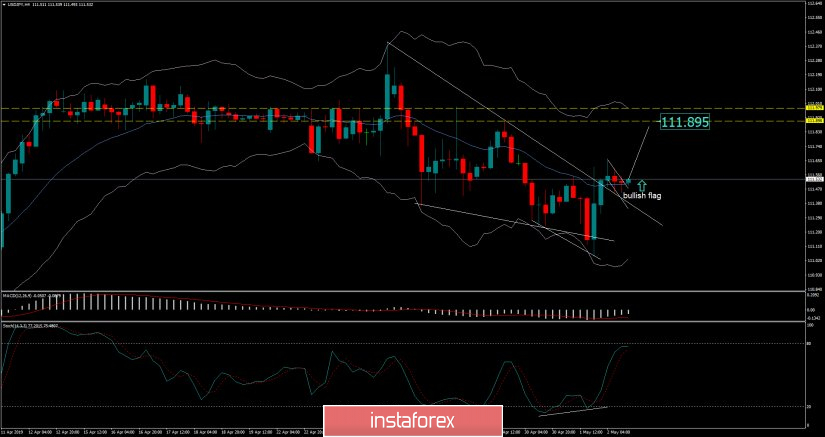
Yellow horizontal lines – Resistance levels
Smaller white lines – bullish flag pattern (continuation)
Larger white line – resistance trendline
USD/JPY did break the key supply trendline in the background, which is sign that buyers took control from sellers. Watching the H4 time-frame, we found that there is the bullish divergence on the Stochastic oscillator in the background combined with the bullish flag after the breakout of resistance, which is strong sign for further upside. Resistance levels are seen at the price of 111.89 and 111.97. Key support remains at the price of 111.00. Watch for buying opportunities.