 English
  Русский
 Bahasa Indonesia
 Bahasa Malay
 ไทย
ไทย Español
 Deutsch
 Български
 Français
 Tiếng Việt
 中文
中文 বাংলা
বাংলা हिन्दी
 Čeština
 Українська
 Română

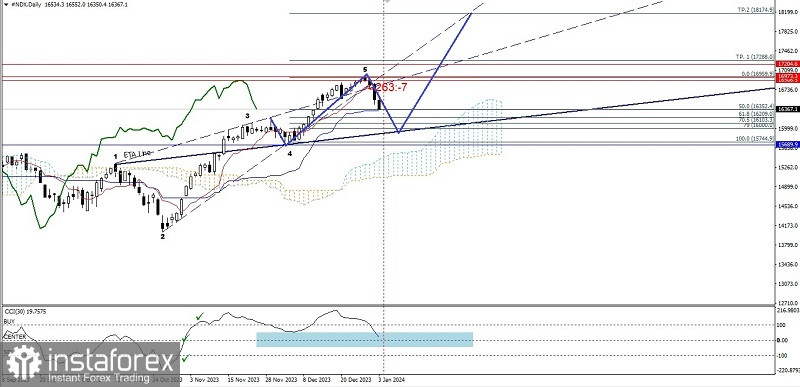
On the daily chart, Nasdaq 100 index seems appear on the price movement and Tenkansen, Kinjun Sen, as well as Chikou Span is above the Kumo which means the Bullish momentum still strong enough. But with the appearance of Rising Wedge pattern, it gives the clue that in a few days ahead, has the potential to corrected below especially if Kinjunsen (biru) managed to break below then the next level to be aim will be ETA Line and the next is Senkou Span A from Kumo if the levels able to hold the downwarc correction at #NDX, then this index has the potential to return be strongly appreciated up to the level area of 16959.9-17288.0 as the main target, and if the momentum as well as the volatility is strong enough, then the level 18174.9 will be the next target to be aimed.
(Disclaimer)