 English
  Русский
 Bahasa Indonesia
 Bahasa Malay
 ไทย
ไทย Español
 Deutsch
 Български
 Français
 Tiếng Việt
 中文
中文 বাংলা
বাংলা हिन्दी
 Čeština
 Українська
 Română

Gold has been trading upwards today and the momentum is on the upside. We see potential more upside in the next period so buying opportunities are preferable.
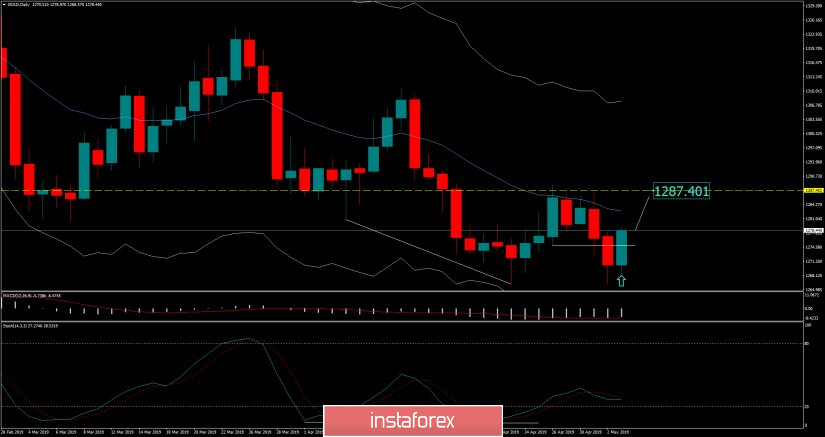
Yellow horizontal line – resistance cluster
Blue line – Median Keltner line 20 EMA (current resistance)
White horizontal line – Broken resistance
Strong bullish movement on the Gold today and baking into the 4-day trading range. The fact that Gold did back into the trading range is telling us that sellers didn't have power to sustain down break and that buyers reacted. The resistance at the price of $1.275 didn't hold and buyers are in control. Key short-term upward reference is seen at $1.287. Daily bullish divergence on the Stochastic oscillator is still in the background and that is another sign of potential strength on the Gold.