 English
  Русский
 Bahasa Indonesia
 Bahasa Malay
 ไทย
ไทย Español
 Deutsch
 Български
 Français
 Tiếng Việt
 中文
中文 বাংলা
বাংলা हिन्दी
 Čeština
 Українська
 Română

BTC lost the upside momentum from last week and it started to form balance area, which is sign for the potential downward correction.
Technical picture:
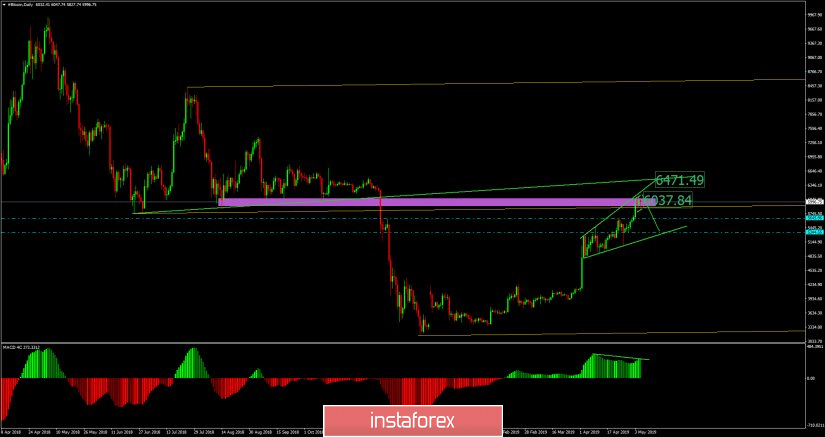
Purple horizontal rectangle – resistance cluster
Orange median line – Pitchfork median line (mean)/resistance
Upper rising green line – Diagonal resistance
The market started to balance at level of $6.100 and on the critical resistance, which may be indication of the potential downward correction in the next period. Support levels are seen at the price of $5.645 and $5.344. Strong median Pitchfork line is acting like resistance plus we got strong resistance cluster from the previous price action in the background. The MACD oscillator is suggesting the bearish divergence, which is another sign of the potential weakness on BTC. Watch for selling opportunities with the target at $5.645.