 English
  Русский
 Bahasa Indonesia
 Bahasa Malay
 ไทย
ไทย Español
 Deutsch
 Български
 Français
 Tiếng Việt
 中文
中文 বাংলা
বাংলা हिन्दी
 Čeština
 Українська
 Română

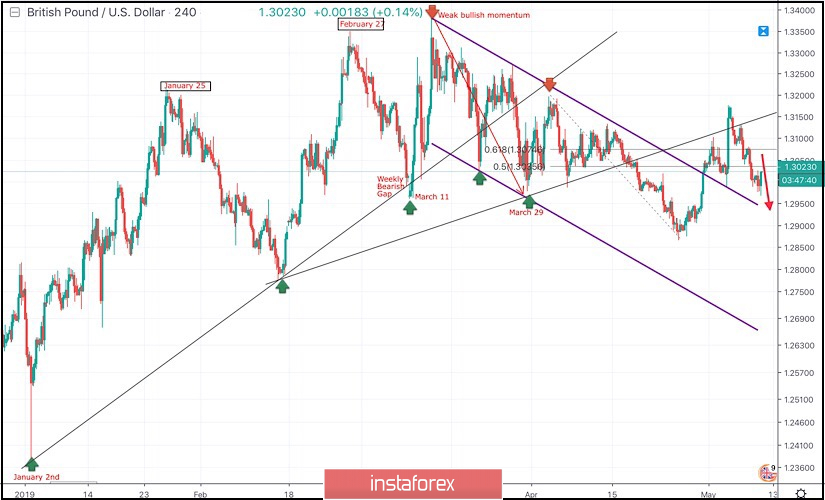
On March 29, the price levels of 1.2980 (the lower limit of the newly-established bearish movement channel) demonstrated significant bullish rejection.
This brought the GBPUSD pair again towards the price zone of (1.3160-1.3180) where the upper limit of the depicted bearish channel as well as the backside of the depicted broken uptrend line demonstrated significant bearish rejection.
Since then, Short-term outlook has turned into bearish with intermediate-term bearish targets projected towards 1.2900 and 1.2850.
Last week, a bullish pullback was executed towards the price levels around 1.3035 - 1.3070 (50% - 61.8% Fibonacci levels) where temporary bearish rejection was demonstrated.
However, by the end of Friday's consolidations, significant bullish momentum was initiated around 1.3000.
Hence, a bullish breakout above 1.3075 was temporarily achieved.
Temporarily, short-term outlook turns to become bullish until bearish breakdown below 1.3035 (50% Fibonacci level) was achieved earlier Yesterday.
Currently, The price zone of 1.3030-1.3060 constitutes a prominent supply-zone to be watched for bearish entries.
On the other hand, H4 bullish breakout above 1.3075 enhances a quick bullish visit towards 1.3150 and 1.3200 where the most recent top was established on May 3.
Trade Recommendations:
Conservative traders should be waiting for signs of bearish reversal around the depicted price levels (1.3035-1.3070) as a valid SELL signal.
T/p levels to be located around 1.2950 and 2880.
Any bullish breakout above 1.3080 invalidates this bearish scenario.