English
  Русский
 Bahasa Indonesia
 Bahasa Malay
 ไทย
ไทย Español
 Deutsch
 Български
 Français
 Tiếng Việt
 中文
中文 বাংলা
বাংলা हिन्दी
 Čeština
 Українська
 Română

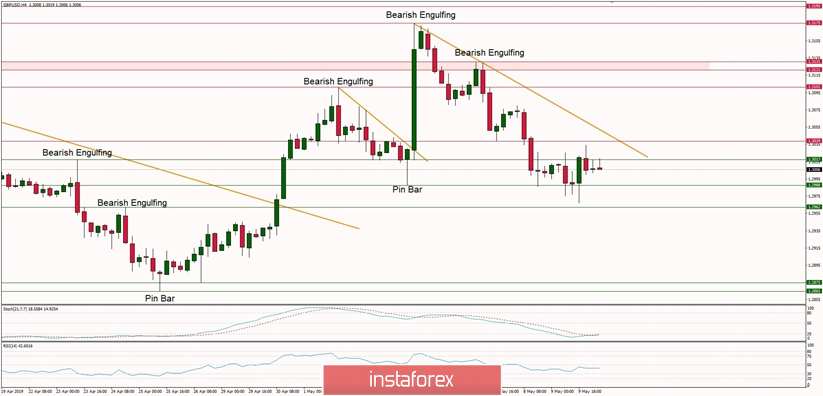
The market is trading in a narrow range
Technical Market Overview:
The GBP/USD pair has made an interesting candlestick pattern at the level of 1.2970 that might indicate a potential termination of the move down. In order to do this, the bulls would have to break through the technical resistance at the level of 1.3039, but so far the price is trading in a narrow range between the levels of 1.2988 - 1.3017 in oversold market conditions. The momentum is so far neutral but can change to bullish again any time soon.
Weekly Pivot Points:
WR3 - 1.3556
WR2 - 1.3373
WR1 - 1.3290
Weekly Pivot - 1.3079
WS1 - 1.3017
WS2 - 1.2819
WS3 - 1.2743
Trading Recommendations:
All the buy orders are still good to play, but the daytraders should be aware of the importance of the level of 1.2988 as any violation of this level will change the short-term outlook to more bearish. The support at 1.2988 is the line in the sand for bulls, any candle close below this level will means the bears have the control over the market.