English
  Русский
 Bahasa Indonesia
 Bahasa Malay
 ไทย
ไทย Español
 Deutsch
 Български
 Français
 Tiếng Việt
 中文
中文 বাংলা
বাংলা हिन्दी
 Čeština
 Українська
 Română

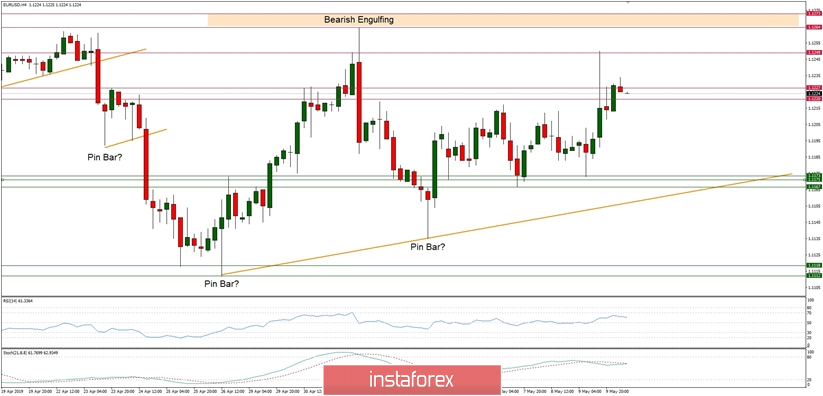
Technical Market Overview:
The EUR/USD pair has broken through all the important Fibonacci retracements and tested the technical resistance at the level of 1.1249. There is an interesting candle at this level with a long upper shadow that indicates the bearish activity at this market prices. Moreover, the market returned to the range very quickly and now is trying to bounce and rally again. The key technical support zone is located between the levels of 1.1167- 1.1176 and any violation of this zone is a strong bearish signal.
Weekly Pivot Points:
WR3 - 1.1382
WR2 - 1.1317
WR1 - 1.1252
Weekly Pivot - 1.1192
WS1 - 1.1128
WS2 - 1.1061
WS3 - 1.0995
Trading Recommendations:
After all of the Fibonacci retracement levels have been broken, the market is trading in the range located between the levels of 1.1167 - 1.1243. The best short-term trading strategy for this kind of directionless market is to trade the extremes, like technical resistance at the level of 1.1249 (sell) or technical support at the level of 1.1167 (buy) until the market will decide which direction it wants to go.