 English
  Русский
 Bahasa Indonesia
 Bahasa Malay
 ไทย
ไทย Español
 Deutsch
 Български
 Français
 Tiếng Việt
 中文
中文 বাংলা
বাংলা हिन्दी
 Čeština
 Українська
 Română

GBP/USD is trading sideways to upwards at the price of 1.3024 in past 24 hours. We still expect upside on the GBP and further strength.
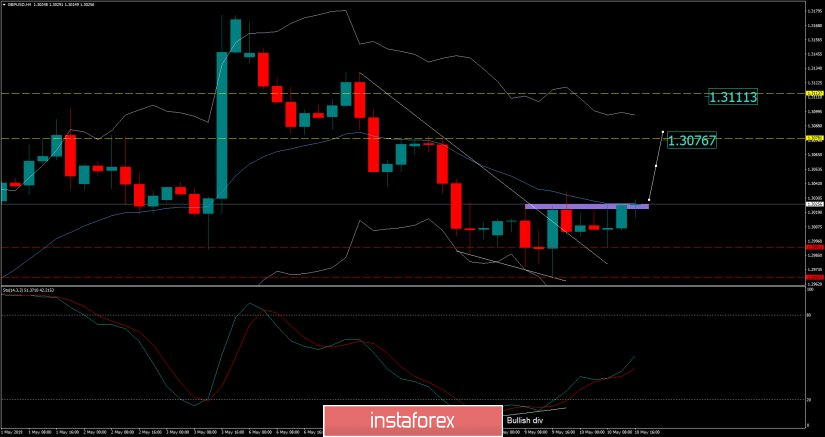
Purple rectangle – Resistance 1.3024
Red horizontal line – Support 1.2991
Red horizontal line – Support 2 1.2967
We found that bullish divergence on the Stochastic oscillator on the 4H time – frame did set the bullish tone. We also found that there is broken supply trendline (white diagonal line), which is another sign of the potential strength. The GBP didn't rally for 4 days and we expect potential rally.
Upward references are set:
1.3076
1.3111
Downward references:
1.2991
1.2967
Our advice is to watch for buying opportunities with the first target at 1.3076. As long as the price is trading above the 1.2967 the trend will remain bullish.