 English
  Русский
 Bahasa Indonesia
 Bahasa Malay
 ไทย
ไทย Español
 Deutsch
 Български
 Français
 Tiếng Việt
 中文
中文 বাংলা
বাংলা हिन्दी
 Čeština
 Українська
 Română

Gold has been trading sideways at the price of $1.287. The intraday momentum is bullish and there is also potential for the breakout of the balance, which is positive sign for the Gold. Buying opportunities are preferable.
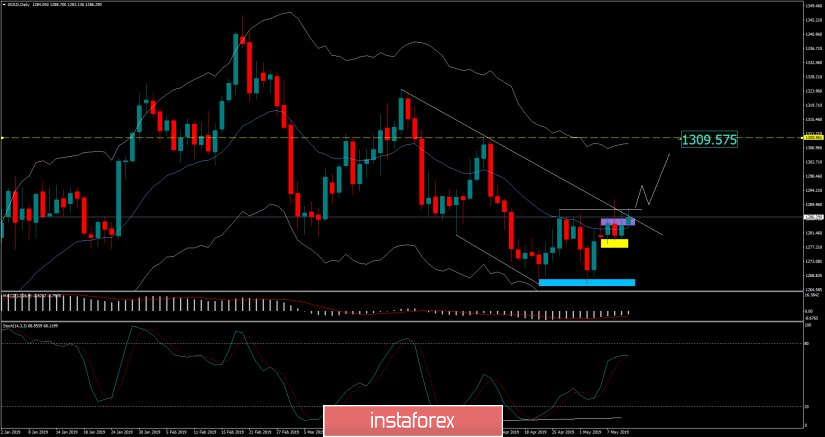
Purple rectangle – Resistance $1.285
White horizontal line – Resistance 2 ($1.289)
White diagonal line – Resistance on the test
Yellow rectangle – Support 1 ($1.277)
Blue rectangle – Major support $1.265
We found that Gold is trying to breakout few resistance levels and make new push higher. The breakout of the $1.291 would confirm bullish momentum and potential test of the $1.309. The medium Keltner line has started to act like support and that is positive sign for the Gold. As long as the Gold is trading above $1.277, the trend will remain bullish. Watch for buying opportunities with the first target at $1.309.