 English
  Русский
 Bahasa Indonesia
 Bahasa Malay
 ไทย
ไทย Español
 Deutsch
 Български
 Français
 Tiếng Việt
 中文
中文 বাংলা
বাংলা हिन्दी
 Čeština
 Українська
 Română

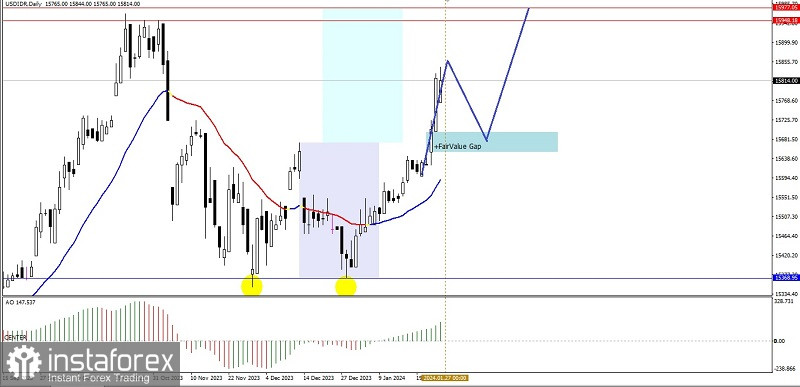
On the daily chart of the exotic currency pair USD/IDR, you can see the appearance of a Double Bottom pattern (yellow circle) as well as price movements moving above the Moving Average, so based on these two things it can be predicted that in the next few days USD/IDR will appreciate upwards to the level of 15948.18 - 15977.05, however, if on the way to that level suddenly there is a downward correction which breaks below the level of 15624.00 then the strengthening scenario previously described will automatically cancel itself.
(Disclaimer)