 English
  Русский
 Bahasa Indonesia
 Bahasa Malay
 ไทย
ไทย Español
 Deutsch
 Български
 Français
 Tiếng Việt
 中文
中文 বাংলা
বাংলা हिन्दी
 Čeština
 Українська
 Română

EURUSD has been trading weak all morning breaking below 1.1150 support and reaching 1.11 as expected. In previous posts continued to note that trend remains bearish as long as price is below 1.1230-1.1260 but there were significant bullish divergence signs by the RSI. EURUSD has now made a 180degree turn with a 4 hour candle looking very bullish.
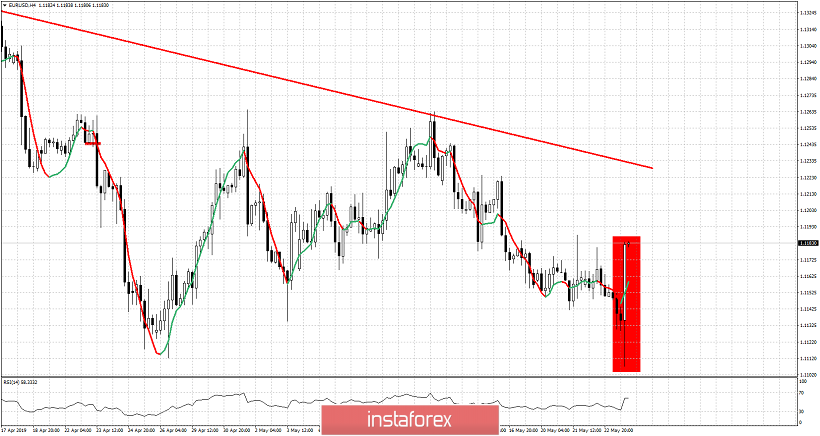
Red rectangle - reversal candlestick
EURUSD has made a low at 1.1107 and closed the 4hour candlestick at 1.1182. Price remains below resistance still but traders should not ignore this long bullish reversal candle pattern. Short-term resistance is where the top of the candle is and recent highs where selling pressures started and lead to the decline to 1.11. Breaking above this level will open the way for a move towards the red resistance trend line at 1.1230. Trend will change to bullish if price breaks above 1.1230-1.1260. Until then bulls need to be cautious. Yes this is an important sign for the bullish scenario but we need to see follow through. Without any follow through this reversal pattern has no meaning.