 English
  Русский
 Bahasa Indonesia
 Bahasa Malay
 ไทย
ไทย Español
 Deutsch
 Български
 Français
 Tiếng Việt
 中文
中文 বাংলা
বাংলা हिन्दी
 Čeština
 Українська
 Română

GBP has been trading upwards. The price tested the level of 1.2117. Anyway, I found potential fake breakout of yesterday's high at 1.2684, which is sign that buying at this stage looks risky.
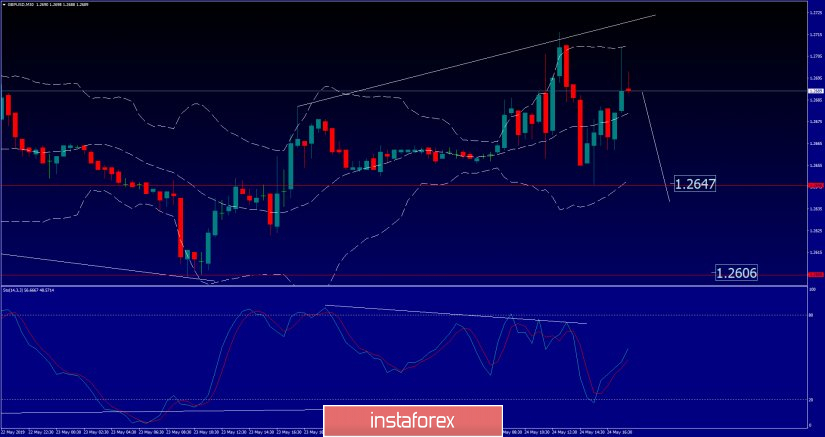
Red horizontal line – swing low support
Red horizontal line 2- Swing low support 2
White lines – Bolinger bands
GBp/USD did try to push higher but we found that bearish divergence on the Stochastic oscillator, which is sign for potential downside. Key intraday resistance is set at the price of 1.2716. Downward references are set at 1.2647 and 1.2606. Our advice is to watch for potential selling opportunities. The first downward target is set at the price of 1.2647.