 English
  Русский
 Bahasa Indonesia
 Bahasa Malay
 ไทย
ไทย Español
 Deutsch
 Български
 Français
 Tiếng Việt
 中文
中文 বাংলা
বাংলা हिन्दी
 Čeština
 Українська
 Română

Gold has been trading sideways at the price of $1.285.35. We found that Gold lost momentum on the last up swing, which is potential sign of the downward movement.
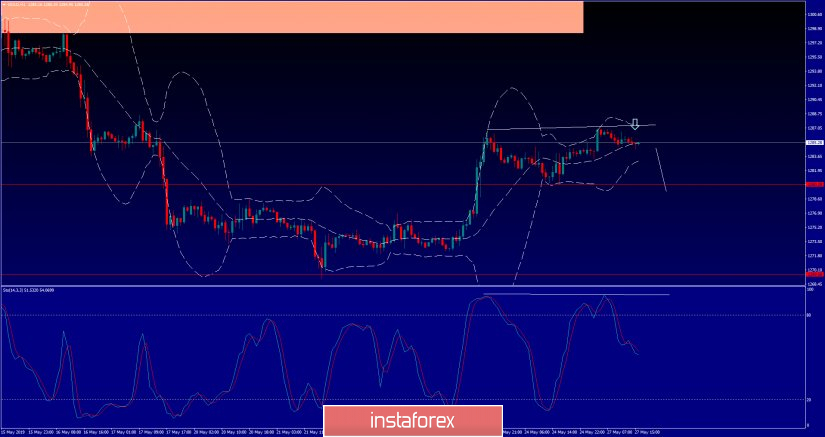
White line – bearish divergence
Red horizontal line- Support 1
Red horizontal line– Support 2
We found bearish divergence on the Stochastic oscillator, which is sign of the losing momentum on the upside. We also found fial breakout of the Friday's high at $1.286, which is another sign of the wekaness. Support is seen at the price of $1.280 and $1.270. Resistance level is set at the price of $1.287. Watch for potential selling opportunities with the first target at $1.280.