 English
  Русский
 Bahasa Indonesia
 Bahasa Malay
 ไทย
ไทย Español
 Deutsch
 Български
 Français
 Tiếng Việt
 中文
中文 বাংলা
বাংলা हिन्दी
 Čeština
 Українська
 Română

GBP/USD has been trading sideways at the price of 1.2661. Bearish flag is in creation and we expect more downside.
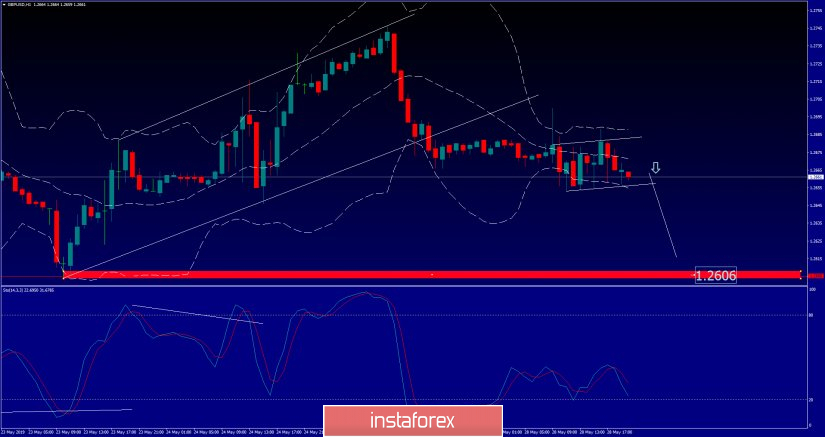
Red rectangle - horizontal support
White lines – Channel borders
GBP/USD did break of the upward channel in the background, which is sign of the underlying weakness on the GBP. We also saw the bearish flag in creation after the breakout of the channel, which is very positive sign of further wekaness on GBP. Key support is seen at the price of 1.2606. Resistance levels are seen at 1.2688 and 1.2700. Watch for selling opportunities on the break of the bearish flag.