 English
  Русский
 Bahasa Indonesia
 Bahasa Malay
 ไทย
ไทย Español
 Deutsch
 Български
 Français
 Tiếng Việt
 中文
中文 বাংলা
বাংলা हिन्दी
 Čeština
 Українська
 Română

BTC has been trading sideways at the price of $8.760. The price tested the level of $8.473 as we planned and provided us a good buy opportunity.
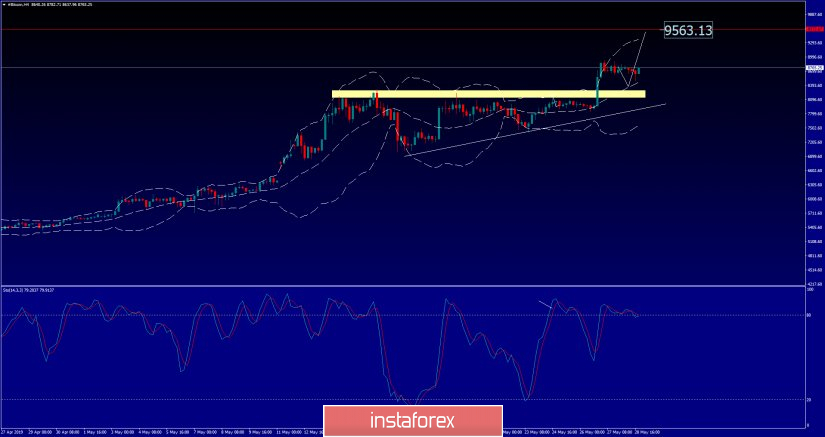
White rectangle – horizonal support
Red horizontal line – projected target
Ascending triangle is active on the BTC and we expect more upside. Price did went to test the middle of the Bolinger band, which is is support for further upside. Additionally, there is the bullish flag intraday in creation, which is another sign of the strength. Support level is seen at the price of $8.310. Resistance is seen at the price of $9.563. Watch for buying opportunities.