 English
  Русский
 Bahasa Indonesia
 Bahasa Malay
 ไทย
ไทย Español
 Deutsch
 Български
 Français
 Tiếng Việt
 中文
中文 বাংলা
বাংলা हिन्दी
 Čeština
 Українська
 Română

BTC did reject from the upper diagonal of the downward channel at $8.750, which influenced sellers. There is potential for down plan and potential test of $8.422.
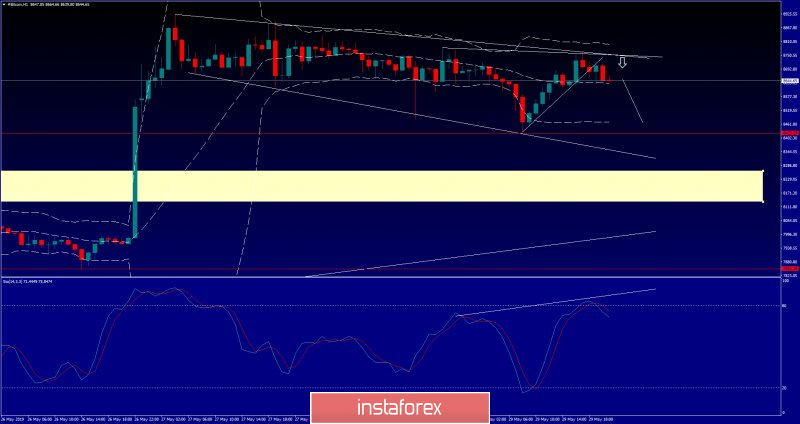
White lines – Downward channel
Red line – Support 1
White rectangle – Support 2
BTC did successful test of the resistance and also did successful breakout of the upward trend line, which is sign that sellers are in control. We found the bearish divergence on the Stochastic oscillator, which is another sign of the weakness. As long as the BTC is trading below the $8.926, we are bearish. Support levels are seen at $8.422 and $8.230.