 English
  Русский
 Bahasa Indonesia
 Bahasa Malay
 ไทย
ไทย Español
 Deutsch
 Български
 Français
 Tiếng Việt
 中文
中文 বাংলা
বাংলা हिन्दी
 Čeština
 Українська
 Română

Gold price has broken above the critical resistance area of $1,290-$1,300 and has not looked back. Anyone standing in its way has been hit hard. Gold price is rising vertically. The signs were there and the confirmation also.
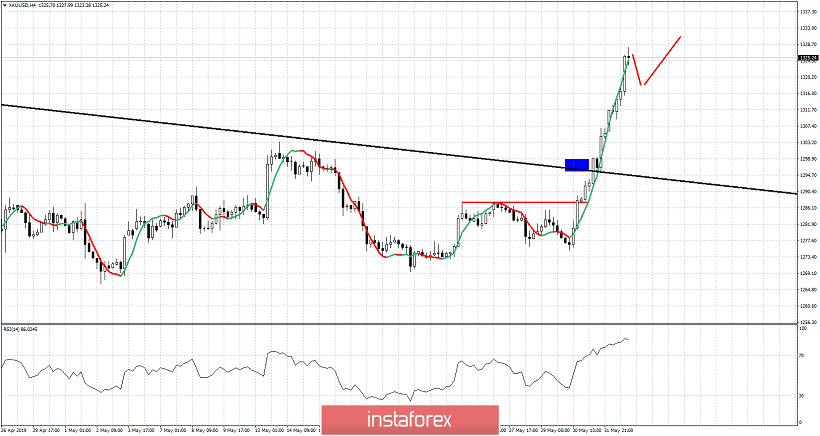
Red rectangle - short-term resistance
Blue rectangle - bounce target and resistance area
Black line - major resistance trend line
Red lines -expected path ahead
Gold price is trading above $1,320 while a couple sessions ago it was still below $1,300. Gold price has broken each resistance level found in its way and even the major resistance level at $1,300. Gold since then has not looked back and continues to rise towards February highs. Gold bulls now focus on the major long-term resistance at $1,350-60 area. Breaking above it would be a very important bullish signal. Rejection at $1,350-60 could mean reversal back to $1,300 or lower. For now bulls seem in control of the trend and ready to challenge $1,350.