 English
  Русский
 Bahasa Indonesia
 Bahasa Malay
 ไทย
ไทย Español
 Deutsch
 Български
 Français
 Tiếng Việt
 中文
中文 বাংলা
বাংলা हिन्दी
 Čeština
 Українська
 Română

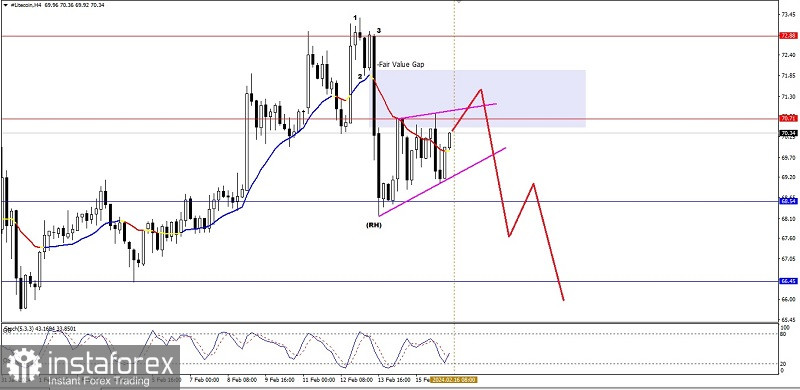
If we look at the 4-hour chart of the Litecoin cryptocurrency, we can see a Bearish 123 pattern followed by the apperance of a Bearish Ross Hook (RH) pattern and a Rising Wedge pattern, all of which confirms that in the near future Litecoin has the potential to weaken down to level 68.16. If this level is successfully broken downwards then Litecoin will have the potential to continue weakening to level 66.45, but if on its way down there suddenly occurs an upward correction which breaks above level 72.93 then all the decline scenarios that have been described previously will automatically cancel themselves.
(Disclaimer)