 English
  Русский
 Bahasa Indonesia
 Bahasa Malay
 ไทย
ไทย Español
 Deutsch
 Български
 Français
 Tiếng Việt
 中文
中文 বাংলা
বাংলা हिन्दी
 Čeština
 Українська
 Română

USDJPY has reached the lower boundary of a huge triangle pattern valid since June 2015. The room to move is getting smaller and a breakout could signal a big move for this pair. For now support remains respected.
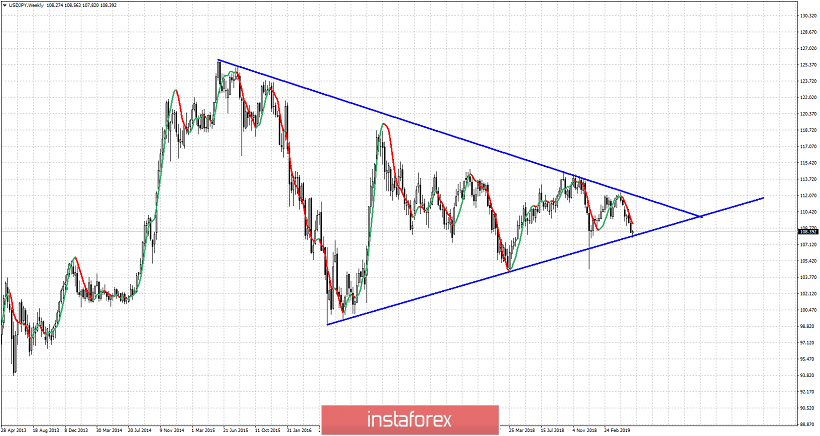
The lower triangle boundary is found at 107.90-108 and this week price has touched it. As long as price is above this level, we should expect one more bounce at least towards the upper triangle boundary around 111.50. Risk reward favors bullish positions now as price is just above the support trend line. Bulls have so far respected support and have stopped the declining trend of USDJPY. Short-term resistance is found at 110.40-110.45 and a break above it would open the way for a push towards 111.50-112