 English
  Русский
 Bahasa Indonesia
 Bahasa Malay
 ไทย
ไทย Español
 Deutsch
 Български
 Français
 Tiếng Việt
 中文
中文 বাংলা
বাংলা हिन्दी
 Čeština
 Українська
 Română

Gold price ended the week close to its highest level and to new weekly closing highs, even above February highs. There is very important long-term resistance at $1,350 and it is very worrying the fact that we have bearish divergence signs.
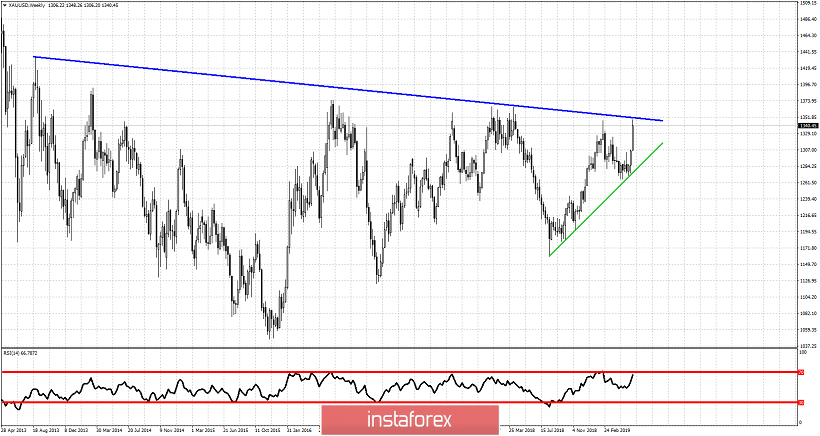
Blue line - major resistance trend line
Green line - support trend line
Gold price has reached our second target of $1,350-60 area after breaking above $1,288. Gold price has respected the green trend line support and has managed to stay above it. Bulls remain in control of the trend, however we should not ignore the bearish divergence signs in the RSI. Gold price has resistance at $1,350-60 and bulls do not want to see a rejection at current levels. Bulls want to see price break out and above the major resistance trend line. Traders need to be very careful.