 English
  Русский
 Bahasa Indonesia
 Bahasa Malay
 ไทย
ไทย Español
 Deutsch
 Български
 Français
 Tiếng Việt
 中文
中文 বাংলা
বাংলা हिन्दी
 Čeština
 Українська
 Română

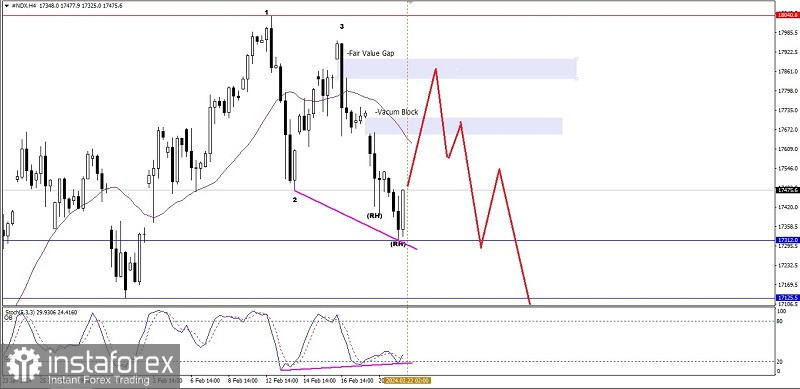
If we look at the 4-hour chart of the Nasdaq 100 index, we can see the emergence of a Bearish 123 pattern followed by several Bearish Ross Hooks (RH), which gives an indication that in the near future #NDX has the potential to weaken down to level 17312.0 as the main target and level 17125.5 where this is also confirmed by the price movement which moves below the WMA 30 Shift 2 which also has a downward slope but with the emergence of a Hidden Deviation pattern between the price movement and the Stochastic Oscillator indicator, in the near future there may be an upward correction but during this correction does not penetrate above level 17951.1, then the weakening scenario described previously is still ongoing and active.
(Disclaimer)