 English
  Русский
 Bahasa Indonesia
 Bahasa Malay
 ไทย
ไทย Español
 Deutsch
 Български
 Français
 Tiếng Việt
 中文
中文 বাংলা
বাংলা हिन्दी
 Čeština
 Українська
 Română

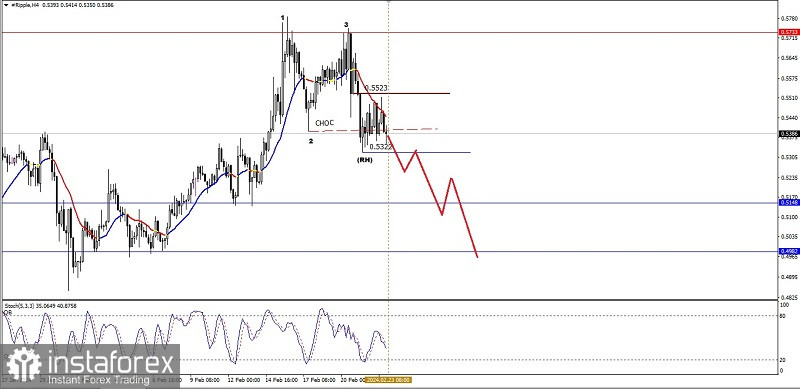
From what we can see, the price movement of the Ripple cryptocurrency on the 4-hour chart shows that there is a Bearish 123 pattern followed by a Ross Hook, coupled with the Ripple price movement which is below WMA 20 which has a sharp downward slope and the Stochastic Oscillator indicator which is crossing downwards, so It is certain that the weakening momentum on Ripple's 4-hour chart is quite strong so that in the near future as long as there is no upward correction that breaks above the 0.5733 level, Ripple will try to breaks below the 0.5322 level. If this level is successfully breaks below, the main target to be achieved is level 0.5148 as the main target and level 0.4982 as the next target if the momentum and volatility are strong enough.
(Disclaimer)