 English
  Русский
 Bahasa Indonesia
 Bahasa Malay
 ไทย
ไทย Español
 Deutsch
 Български
 Français
 Tiếng Việt
 中文
中文 বাংলা
বাংলা हिन्दी
 Čeština
 Українська
 Română

Gold price has bounced off the 38% Fibonacci retracement support area but it looks like bulls are not strong enough to recapture the major resistance trend level at $1,350. This rejection if followed by a move below $1,320 could lead to a sharp decline towards $1,300.
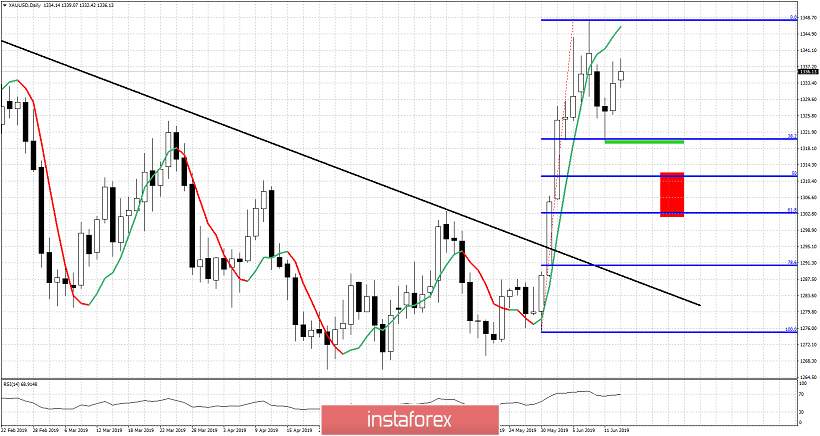
Green rectangle - support
Red rectangle - target if support fails to hold
Gold price should move towards the red rectangle target area if support at the green rectangle fails to hold. $1,300 is a major support area. Even if we break below $1,320, bulls will continue to hope for a higher low and an upward reversal. If $1,300 is lost then this would be a bearish sign for the medium-term trend. Until then bulls hope for this pull back to be shallow and short-lived. Breaking above $1,348-50 would give us a bullish sign.