 English
  Русский
 Bahasa Indonesia
 Bahasa Malay
 ไทย
ไทย Español
 Deutsch
 Български
 Français
 Tiếng Việt
 中文
中文 বাংলা
বাংলা हिन्दी
 Čeština
 Українська
 Română

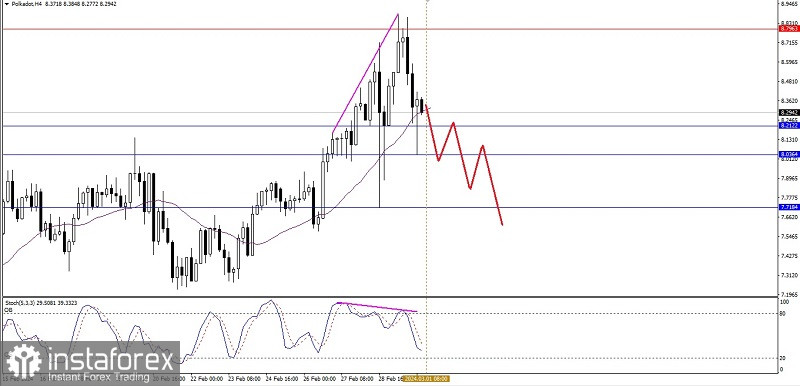
On the 4-hour chart of the Polkadot cryptocurrency, deviations can be seen between price movements and the Stochastic Oscillator indicator, which shows that in the near future Polkadot has the potential to weaken down to level 8.2122 and if this level is successfully broken below, Polkadot has the potential to continue its weakening up to level 8,364 as the main target and level 7,7184 as the next target which will be achieved if the momentum and volatility are supportive, but if on the way to these target levels suddenly there is a strong upward correction, especially if it breaks above level 8,7963 then all downside scenarios and the weakening previously described will automatically cancel itself.
(Disclaimer)