 English
  Русский
 Bahasa Indonesia
 Bahasa Malay
 ไทย
ไทย Español
 Deutsch
 Български
 Français
 Tiếng Việt
 中文
中文 বাংলা
বাংলা हिन्दी
 Čeština
 Українська
 Română

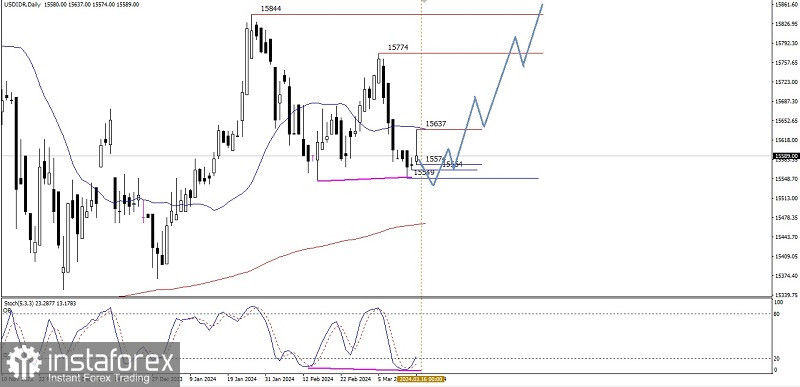
If we look at the Garuda currency on its daily chart, it can be seen that the bias of the USD/IDR is still above the 200 EMA, which means that the USD is still dominating the Rupiah, especially with the addition of hidden deviations between USD/IDR price movements and the Stochastic Oscillator indicator, further emphasizing the confirmation of strengthening of USD/IDR which has the potential to bring USD/IDR higher to level 15637. If this level is successfully broken then USD/IDR has the opportunity to continue strengthening up to level 15744 as the main target and if momentum and volatility support then level 15844 will be the next target. will be aimed at, but all of these USD/IDR strengthening scenarios will automatically cancel if USD/IDR is suddenly corrected down and penetrates below the 15514 level even though the probability is quite small for this to happen in the next few days.
(Disclaimer)