 English
  Русский
 Bahasa Indonesia
 Bahasa Malay
 ไทย
ไทย Español
 Deutsch
 Български
 Français
 Tiếng Việt
 中文
中文 বাংলা
বাংলা हिन्दी
 Čeština
 Українська
 Română

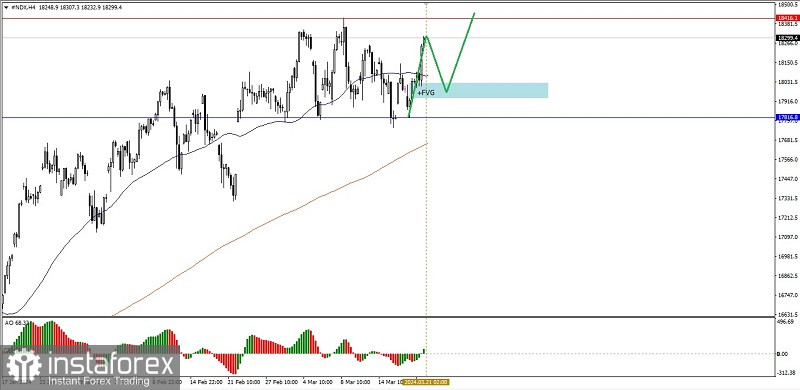
On the 4 hours index of Nasdaq 100 recently, there is Buyers who are still dominates where this is confirmed by the condition of its Golden Cross, MA 50 above MA 200 as well as Awesome Oscillator indicator has already on the positive zone (above the level 0) although actually currently #NDX is inside the Sideways condition, but in the near future #NDX has the potential to corrected down to test the support level which is formed by the Bullish Fair value Gap level area on 18026,5-17931,4. If this level area is strong enough to hold the correction rate and those weakness doesn't breaks below the level 17816,8, then #NX still has the potential to get stronger to the level 18416,1.
(Disclaimer)