 English
  Русский
 Bahasa Indonesia
 Bahasa Malay
 ไทย
ไทย Español
 Deutsch
 Български
 Français
 Tiếng Việt
 中文
中文 বাংলা
বাংলা हिन्दी
 Čeština
 Українська
 Română

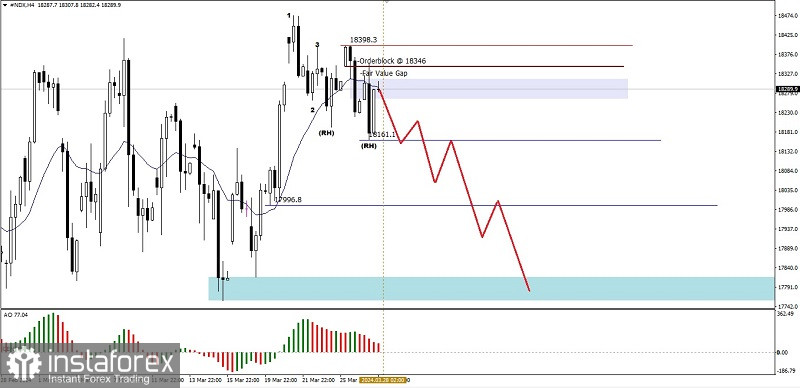
Although on the 4 hour chart of Nasdaq 100 index is moving sideways and ranging, but with the price movement breaking down WMA 20 Shift 2 followed by the appearance of the Bearish 123 pattern followed by several Bearish Ross Hooks (RH) gives an indication that in the near future #NDX has the potential to weaken down to level 18161.1 if this level is successful If it is broken below, #NDX has the potential to continue its decline to the level of 17996.8 as the main target and if the momentum and volatility are supportive then the next level to be aimed at is 17816.8, but if on its way to the target levels mentioned suddenly there will be a correction strengthening, especially if the strengthening correction succeeds in breaking above level 18398.3, then all the downside scenarios that have been described earlier will become invalid and cancel automatically.
(Disclaimer)